mirror of
https://github.com/amithkoujalgi/ollama4j.git
synced 2025-10-14 09:28:58 +02:00
91 lines
2.9 KiB
Markdown
91 lines
2.9 KiB
Markdown
---
|
|
sidebar_position: 5
|
|
|
|
title: Metrics
|
|
---
|
|
|
|
import CodeEmbed from '@site/src/components/CodeEmbed';
|
|
|
|
# Metrics
|
|
|
|
:::warning[Note]
|
|
This is work in progress
|
|
:::
|
|
|
|
Monitoring and understanding the performance of your models and requests is crucial for optimizing and maintaining your
|
|
applications. The Ollama4j library provides built-in support for collecting and exposing various metrics, such as
|
|
request counts, response times, and error rates. These metrics can help you:
|
|
|
|
- Track usage patterns and identify bottlenecks
|
|
- Monitor the health and reliability of your services
|
|
- Set up alerts for abnormal behavior
|
|
- Gain insights for scaling and optimization
|
|
|
|
## Available Metrics
|
|
|
|
Ollama4j exposes several key metrics, including:
|
|
|
|
- **Total Requests**: The number of requests processed by the model.
|
|
- **Response Time**: The time taken to generate a response for each request.
|
|
- **Error Rate**: The percentage of requests that resulted in errors.
|
|
- **Active Sessions**: The number of concurrent sessions or users.
|
|
|
|
These metrics can be accessed programmatically or integrated with monitoring tools such as Prometheus or Grafana for
|
|
visualization and alerting.
|
|
|
|
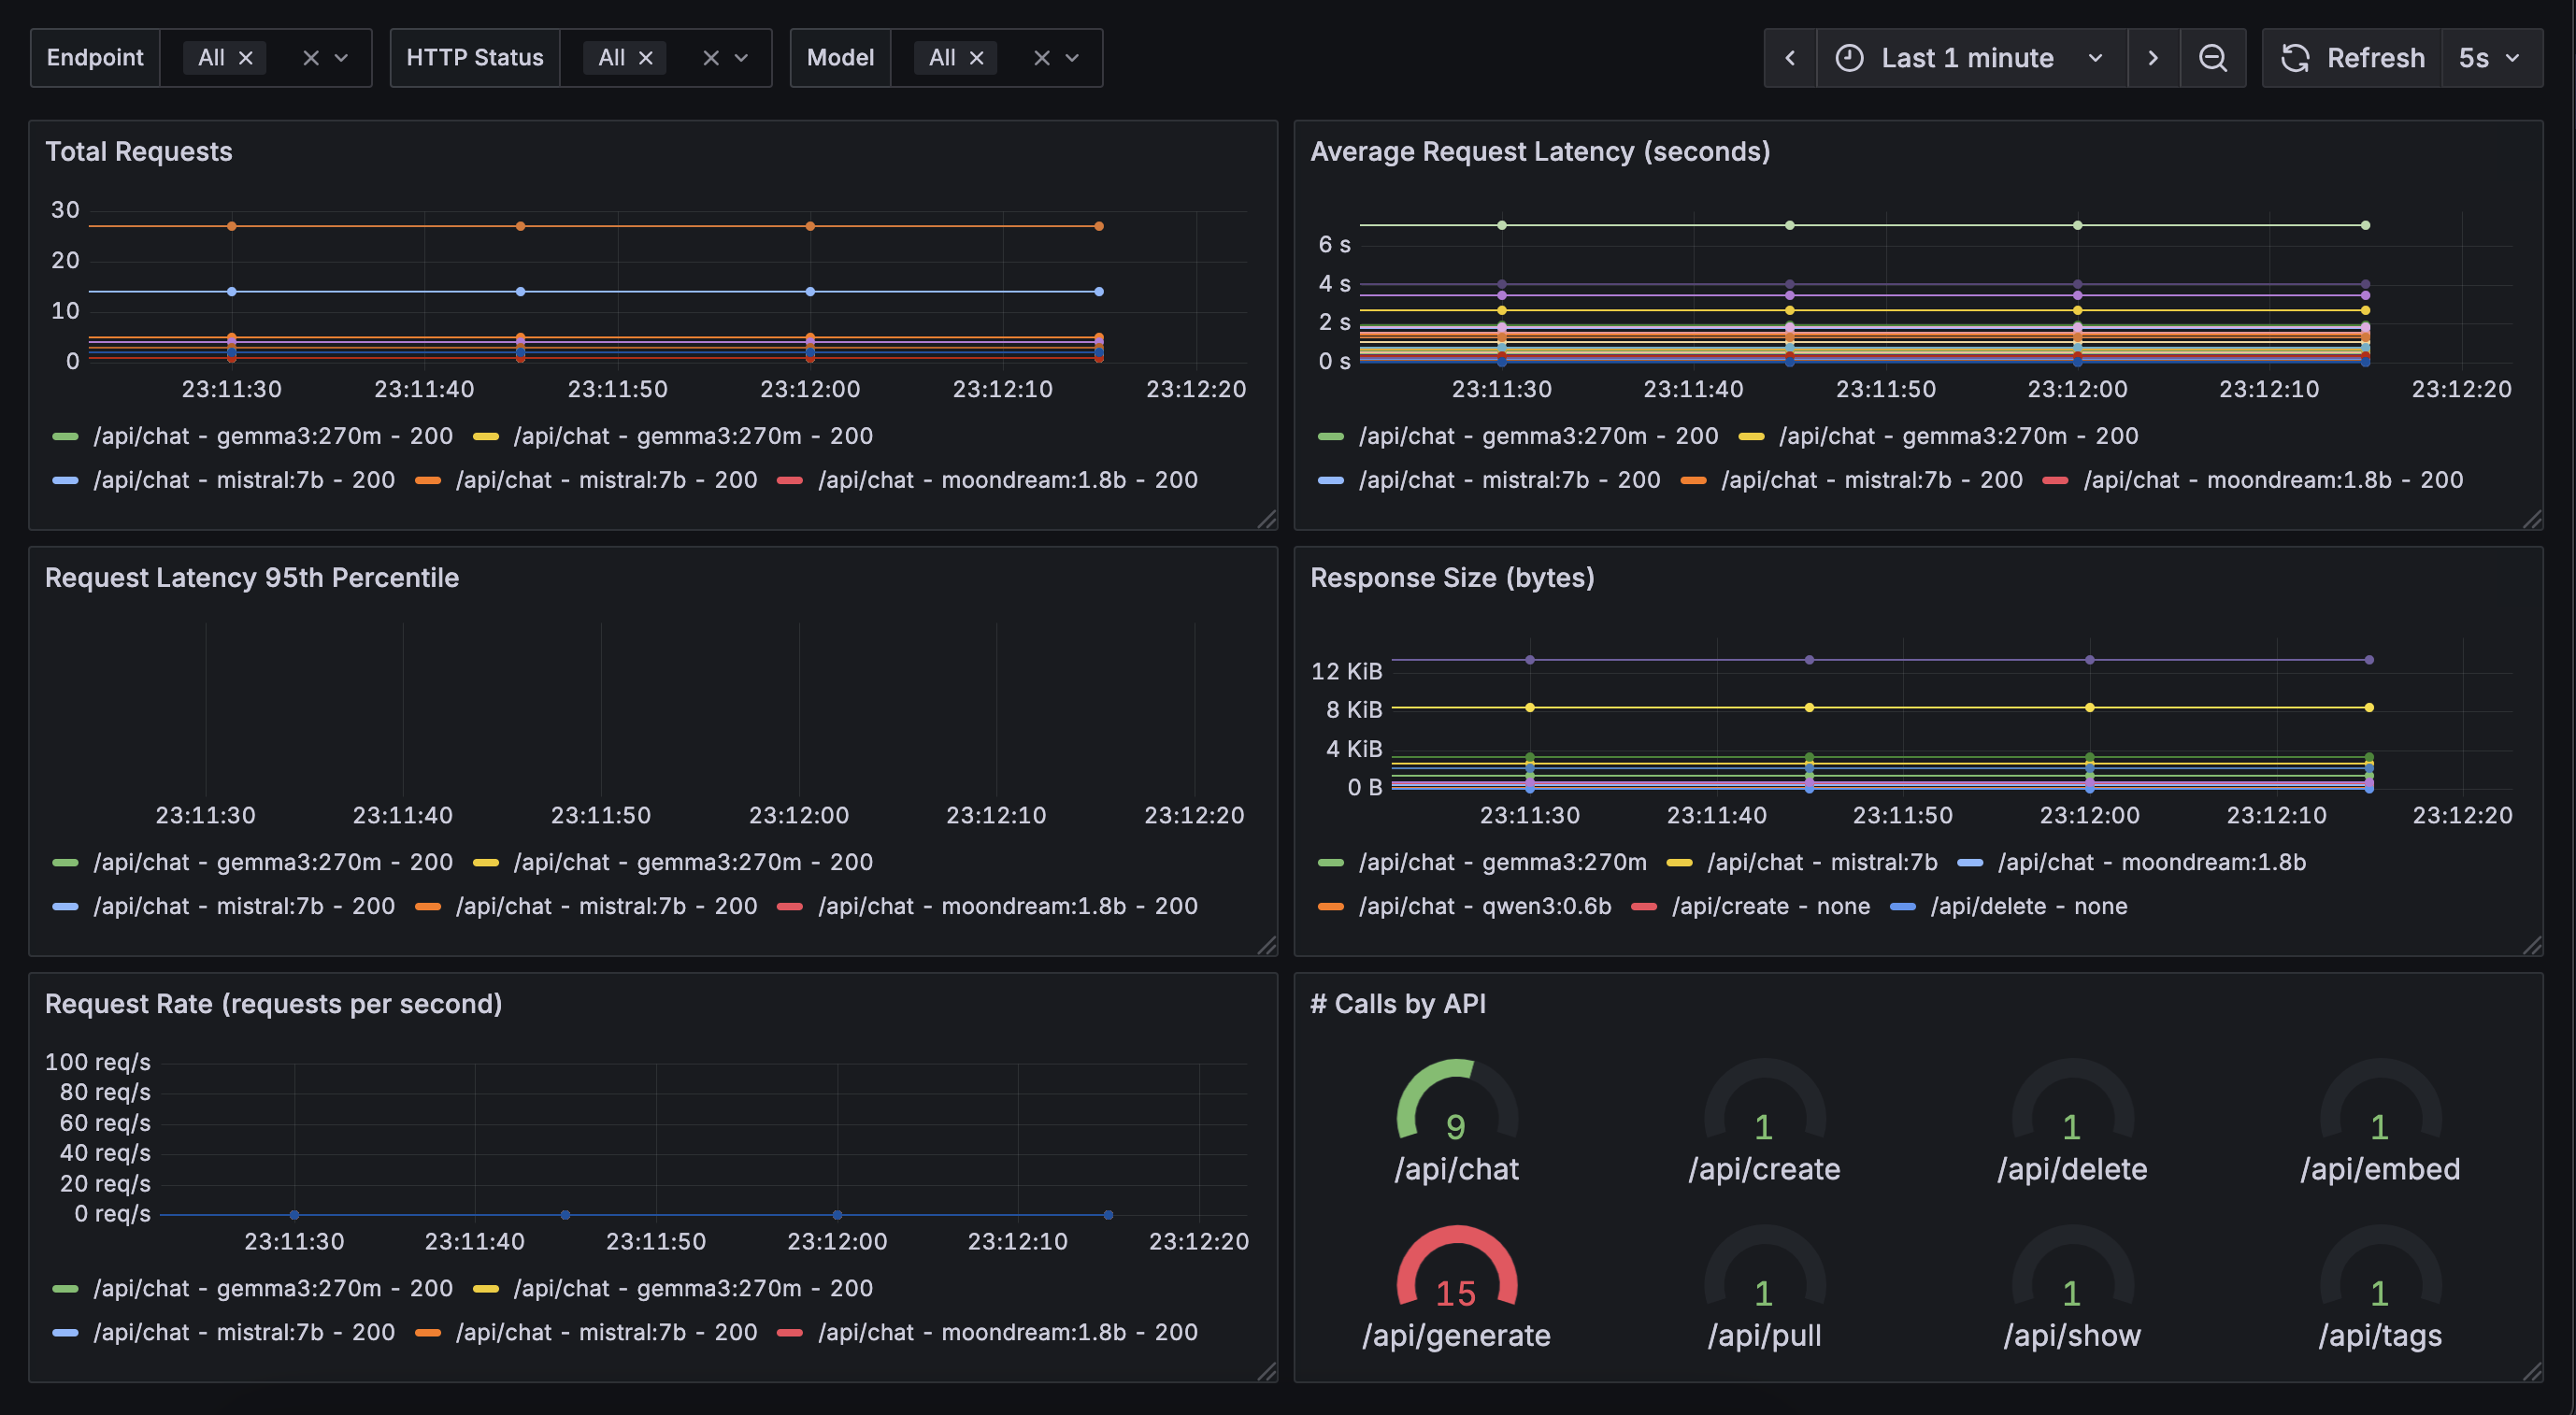
## Example Metrics Dashboard
|
|
|
|
Below is an example of a metrics dashboard visualizing some of these key statistics:
|
|
|
|
|
|
|
|
## Example: Accessing Metrics in Java
|
|
|
|
You can easily access and display metrics in your Java application using Ollama4j.
|
|
|
|
Make sure you have added the `simpleclient_httpserver` dependency in your app for the app to be able to expose the
|
|
metrics via `/metrics` endpoint:
|
|
|
|
```xml
|
|
|
|
<dependency>
|
|
<groupId>io.prometheus</groupId>
|
|
<artifactId>simpleclient_httpserver</artifactId>
|
|
<version>0.16.0</version>
|
|
</dependency>
|
|
```
|
|
|
|
Here is a sample code snippet demonstrating how to retrieve and print metrics on Grafana:
|
|
|
|
<CodeEmbed src="https://raw.githubusercontent.com/ollama4j/ollama4j-examples/refs/heads/main/src/main/java/io/github/ollama4j/examples/MetricsExample.java" />
|
|
|
|
This will start a simple HTTP server with `/metrics` endpoint enabled. Metrics will now available
|
|
at: http://localhost:8080/metrics
|
|
|
|
## Integrating with Monitoring Tools
|
|
|
|
### Grafana
|
|
|
|
Use the following sample `docker-compose` file to host a basic Grafana container.
|
|
|
|
<CodeEmbed src="https://raw.githubusercontent.com/ollama4j/ollama4j-examples/refs/heads/main/docker/docker-compose.yml" />
|
|
|
|
And run:
|
|
|
|
```shell
|
|
docker-compose -f path/to/your/docker-compose.yml up
|
|
```
|
|
|
|
This starts Granfana at http://localhost:3000
|
|
|
|
|
|
[//]: # (To integrate Ollama4j metrics with external monitoring systems, you can export the metrics endpoint and configure your)
|
|
|
|
[//]: # (monitoring tool to scrape or collect the data. Refer to the [integration guide](../integration/monitoring.md) for)
|
|
|
|
[//]: # (detailed instructions.)
|
|
|
|
[//]: # ()
|
|
|
|
[//]: # (For more information on customizing and extending metrics, see the [API documentation](../api/metrics.md).)
|